

As Reported Financial Statements, Line by Line, in Marvin Labs
The financials page in Marvin Labs now has an As reported view. It shows a company's income statement, balance sheet and cash flow statement as the company prints them: its own line items and labels, in its order and nesting, with the product, segment and geography rows it reports under each line. Hover any figure to see the filing that reported it and whether it was restated. AI Analyst Chat and Deep Research Agents read the same statements, so an answer can quote a line item under the name the company gives it.
Two views of the same statements
The existing standardized statements map every company onto one common template. That is what makes a peer comparison work: gross profit means the same thing for every company, and margins, growth rates, FCF and ROIC sit next to the reported lines.
A common template also discards detail that is often relevant. Microsoft's standardized income statement has one operating expense line with R&D and SG&A beneath it. SG&A for fiscal 2026 was $34.7B.
Microsoft's annual report prints sales and marketing ($26.7B) and general and administrative ($8.0B) as separate lines. It also splits both revenue and cost of revenue into Product and Service and Other. In the as reported view, product revenue is $64.7B of $331.8B for fiscal 2026, and product cost of revenue has fallen for two years running while service cost of revenue rose from $58.8B to $94.3B. The standardized template does not carry that split.
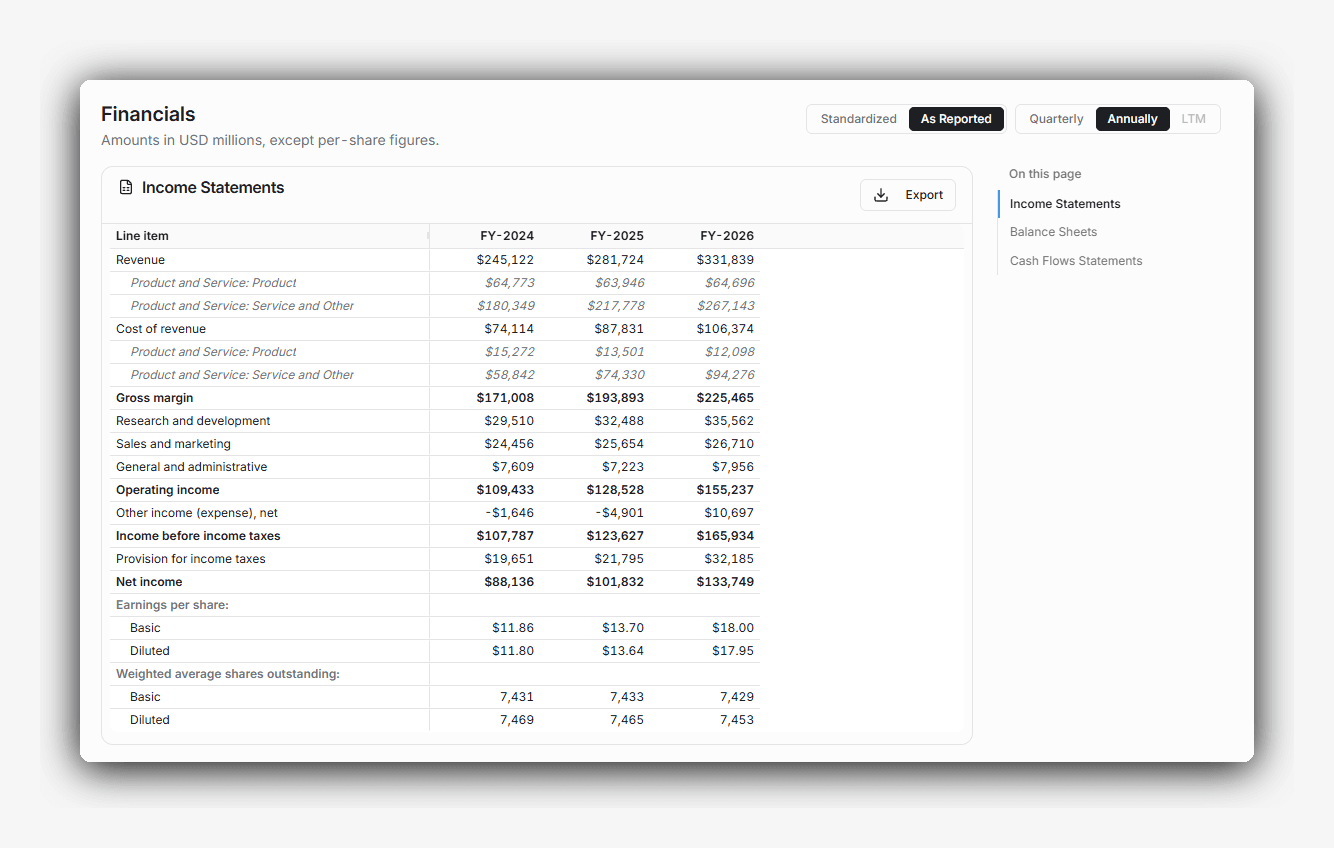
Use the standardized view to compare companies and the as reported view to read one company closely. The switch sits at the top of the financials page, next to the period selector.
The company's own layout
Each statement follows the layout of the company's latest filing:
- Line items and labels as the company prints them, in its order
- Nesting as the company presents it, down to the subsections of current assets and the changes in operating assets and liabilities
- Subtotals such as gross margin, operating income and total current liabilities in bold
- Product, segment and geography rows indented beneath the revenue or cost line that carries them
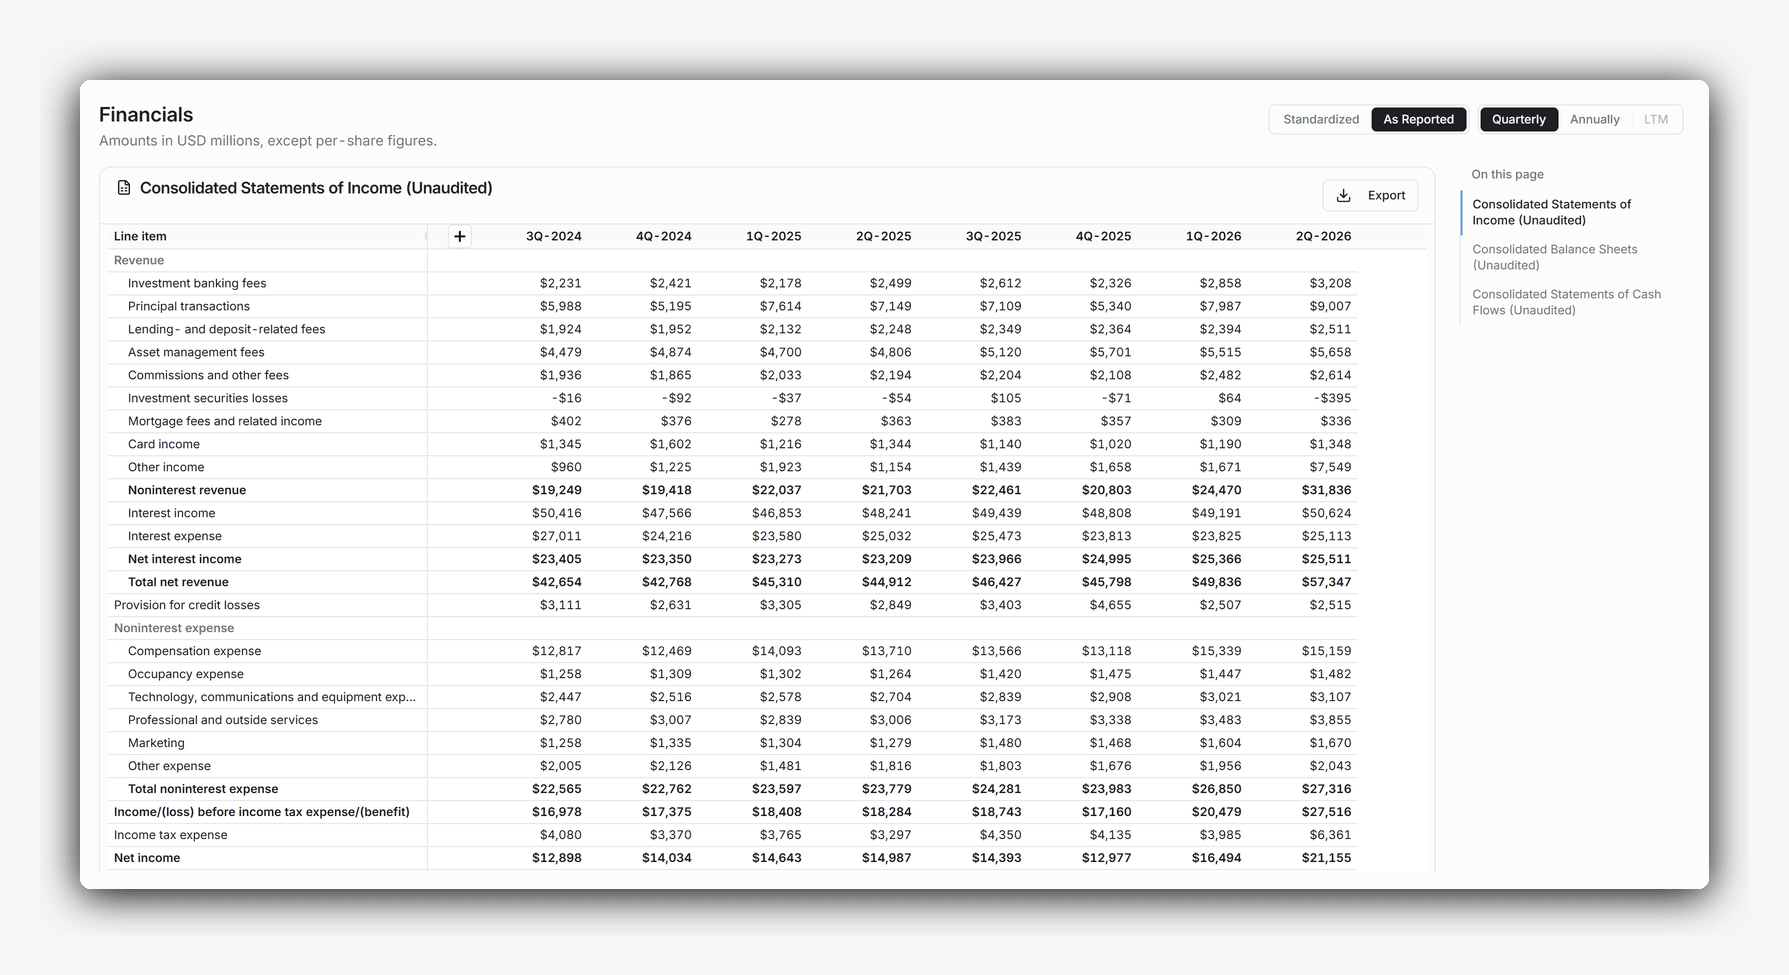
The difference is largest where a business does not fit a general template. A bank's income statement has no cost of revenue or gross margin. JPMorgan Chase reports revenue as a run of fee lines, from investment banking and asset management to card income, followed by noninterest revenue, interest income and expense, and net interest income. In 2Q-2026, investment banking fees were $3.2B, up from $2.5B a year earlier, and principal transactions contributed $9.0B.
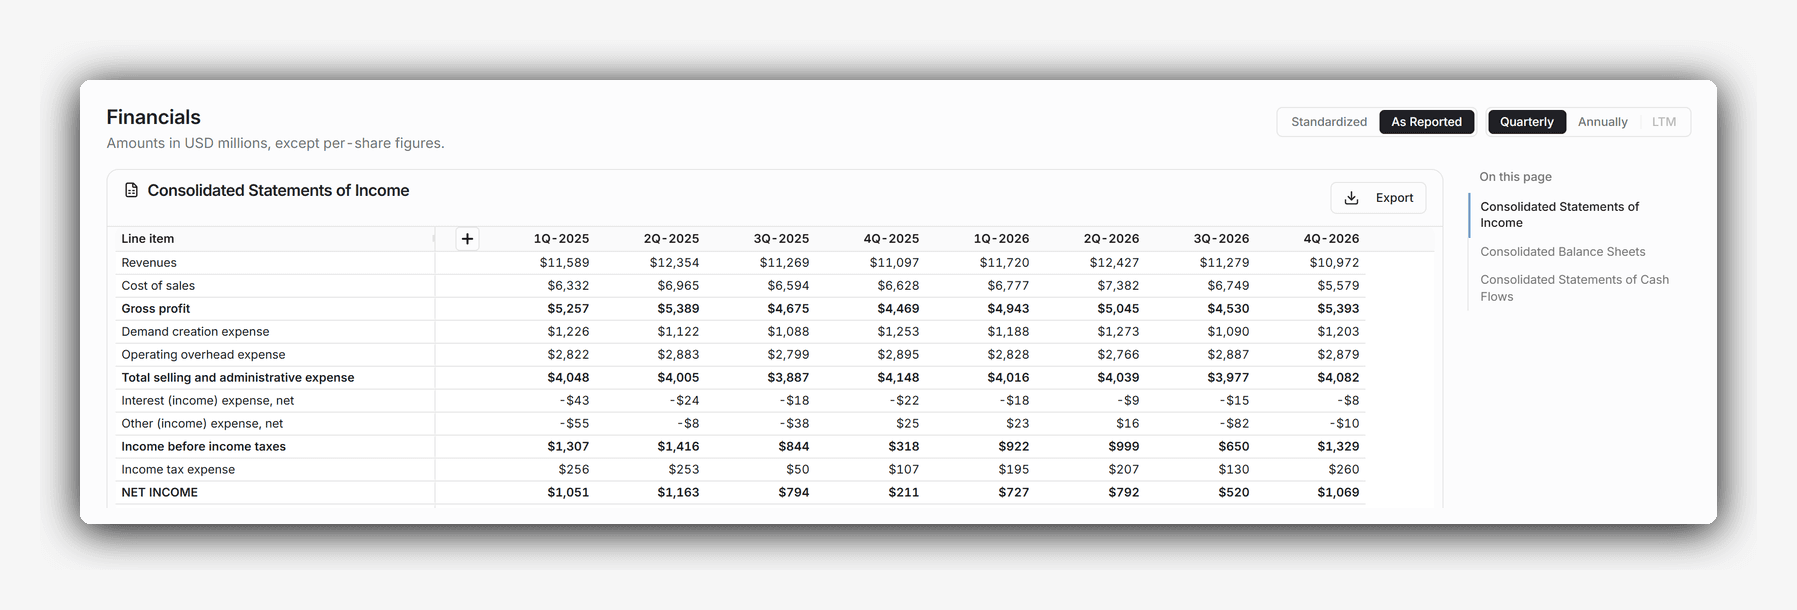
Company-specific lines come through the same way. Nike splits its selling and administrative expense into demand creation expense, its advertising and promotion spend, and operating overhead expense. Demand creation was $4.8B in fiscal 2026 on revenue of $46.4B, roughly level with the prior year. A standardized SG&A line holds both.
Annual history runs ten years and quarterly history five. Older periods show the latest figures the company reported for them, so a restated year shows its restated value, and the tooltip on that figure says it was restated and which filing restated it.
Chat and agents read the same statements
AI Analyst Chat and Deep Research Agents can also access a company's statements as reported, in addition to the standardized figures. Ask for "Microsoft's revenue by product and service as reported, last five fiscal years" and the answer uses the company's own line items, with each period's figures cited to the filing they came from. Company-specific breakdowns, such as a segment's revenue or a line only one company reports, come from the same source.
Chat and agents can also look back. Ask what a company had reported for a period as of an earlier date, and the answer uses the layout and values current at that date, before any later restatement. Figures that a later filing changed are marked as restated, the same way they are on the page.
Export from any financials table
As before, every financials table, standardized and as reported, supports export to CSV and Excel.
Company pages and financials for the evaluation companies can be browsed without an account. Chat and agents need a free evaluation account, no sales call.
Common questions about as reported financial statements
Try it on your coverage
Try Chat and research agents with 1,500 AI credits on the evaluation companies. Create a free evaluation account, with no sales call.
Discuss your coverage and workflow with the founder in a 30-minute call.

Alex is the co-founder and CEO of Marvin Labs. Prior to that, he spent five years in credit structuring and investments at Credit Suisse. He also spent six years as co-founder and CTO at TNX Logistics, which exited via a trade sale. In addition, Alex spent three years in special-situation investments at SIG-i Capital.


